
Last updated on March 10th, 2024 at 04:28 am
In this article, you’ll get 30 money-saving charts to track savings and debt repayments.
Whether you’re saving for a car or vacation a saving chart gives motivation and a sense of achievement.
You need to have a knowledge of how much you’ve performed and where you’re standing.
Today saving money is a basic financial need, you should have a system in place to achieve your saving goal.
And the money-saving chart is key for tracking your progress and staying consistent.
So let’s jump into the discussion.
What Is a Money Savings Chart?
It is a visual representation of a person or household’s savings over a specific time frame. The main aim is to track toward a savings goal, like a house down payment, a vacation, or an emergency fund.
A typical money-saving chart includes:
- a starting balance,
- regular contributions,
- interest income,
- cumulative balance,
- and the targeted amount.
Creating a money savings chart is simple. Here are the steps:
- First, determine the savings goal and the target date for reaching that goal.
- Second, calculate the regular contributions you make towards the end goal, including interest.
- Third, take a paper and plot three columns with date, contributions, and balance.
And your money-saving chart is ready to use. Here is how it looks:
You can create it using spreadsheets, online savings calculators, and budgeting apps. There are also dozens of free templates out there. You can customize them to fit an individual’s specific needs.
Why Should You Use A Money Savings Chart?
Here is why using a money savings chart payoffs:
1. Increased motivation
Watching your progress toward a savings goal can be a powerful motivator. Allows you to track your progress and see contributions adding up over time. This can help to keep them motivated and on track to reach the end goal.
2. Better budgeting
Help individuals identify areas to reduce expenses and increase savings. Also enables you to visualize spending patterns and make necessary adjustments.
3. Evaluation of savings strategies
Money savings charts are helpful in evaluating the effectiveness of various saving strategies. By tracking the progress of different tricks, individuals can determine the methods that are working in their favor.
4. Concrete savings goals
Help make savings goals more tangible and concrete. It makes the goal feel more achievable and can help to keep finances on track.
5. Track multiple savings goals
Money savings charts can also be good to track progress toward one or more savings goals in a single place. This is useful for households that have multiple financial priorities, like saving for a down payment on a house, retirement, and a child’s education.
6. Make informed decisions
You can take informed decisions, such as adjusting your savings goals, or if the target date needs to be extended.
7. Helps to plan for emergencies
You can prepare yourself for unexpected expenses, such as medical bills, car repairs, or job loss.
8. Reach long-term financial goals
You can reach long-term financial goals, such as buying a house, paying off a student loan, or investing.
So you can see how many benefits you can get from using a simple money-saving chart.
FOR MORE INFORMATION READ THIS ARTICLE: How To Set Financial Goals-RamseySolutions
Let’s jump to the next section.
How To Use A Money Savings Chart?
Here are the steps to use a savings chart:
1. Determine your savings goal
The first step in creating a money savings chart is to determine your savings goal. This could be a down payment on a house, a vacation, an emergency fund, or any other financial goal you may have.
2. Set a target date
Once you have determined your savings goal, set a target date for reaching that goal. This will give you a clear deadline to work towards and will help you to stay motivated.
3. Calculate regular contributions
Next, calculate the regular contributions that will be made towards your savings goal. This includes any interest earned. Be realistic with your contributions and make sure you can afford them.
4. Plot the information on a chart
Once you have it, plot it on a chart. Your chart should have the savings balance plotted on the y-axis and the period on the x-axis. The chart should include:
- starting balance
- regular contributions
- cumulative balance
- and interest earned
You can also plot it in column-wise format.
5. Use a budgeting tool
Tools like spreadsheet software, online savings calculators, and budgeting apps are helpful. Many personal finance websites and apps provide templates for creating a savings chart.
6. Track your progress
Once you have created your money savings chart, start tracking your progress. Update your chart on a regular basis, at least once a month, to see how your savings are growing. This will help you stay motivated and on track to reach your goal.
7. Evaluate your progress
Evaluate your progress regularly. Use your chart to evaluate the effectiveness of different savings strategies. Like using automatic transfers to a savings account, making a budget, consistency, or increasing contributions frequency.
8. Adjust a goal if necessary
If you find that you are not on track to reach your savings goal at your target date, adjust your goals if necessary. You may have to increase your contributions or extend your target date.
9. Celebrate your success
When you reach your savings goal, celebrate your success. Use the money for what you planned, and set new savings goals.
RELATED POST:
59 Ways on How to Save Money Even If You Find it Difficult
23 Easy Ways to Save $20000 In a Year From Your Salary (2024)
What To Track With A Money Savings Chart?
Here are some important areas of personal finance to track using money saving chart:
- Retirement Investment (including 401k, IRA, and Roth IRA contribution and growth)
- Paying Off Mortgage (Making monthly mortgage payments and visualizing the remaining balance until it’s paid off completely)
- Auto Fund ( to accumulate enough car fund to meet the price requirement)
- Vacation Savings (having a good vacation for a week or two)
- Paying Off Credit Card Loan (to minimize interest cost and increase credit score)
- Returning Other Loans (personal loans and student loans)
- Covering Child Fees (saving enough throughout the month to meet school fees)
- Building Holidays Fund (for Christmas gifts, parties, outings, Christmas trees, and celebrations)
- Preparing For Insurance Payment ( for paying premiums to an insurance company on a monthly or yearly basis)
- House Savings Goal ( for a house down payment, repairing, and other maintenance)
RELATED POST: 33 Tricks on How to Save Money on Groceries
Let’s jump to the next section.
31 Types Of Money Savings Charts To Reach Your Goal
Here are 30 different types of money-saving trackers:
1. 52-Week Money Savings Chart
You start by saving $1 in the first week and continue to save an increasing amount for the 52 weeks. It’s the easiest challenge to do when it comes to saving money.
With the help of money saving challenge, you can track your progress each week for 52 weeks. For example, you save $1 in the first week, then $2 in the second week, $3 in the third week, and until the 52nd week. In the end, your total savings will be $1,378.
Here is how the 52-week money-saving chart looks:

2. Emergency Savings Tracker
According to Wells Fargo, you should have at least 3 to 6 months of savings in emergency funds. But the amount of money can change spending on your income, expenses, and family.
For example, if your monthly expenses are $3,000 then you can plan to have $9,000 to $18,000 in an emergency fund. So for achieving that milestone money savings chart comes in handy.
You can use the above 52-week chart for saving emergency funds.
RELATED POST: 133 Frugal Living Tips to Save Money and Build Your Financial Future
3. 26-Week Money Savings Chart
The 26-week challenge involves setting aside a certain amount of money each week for 26 weeks. It’s also called a 6-months saving challenge.
The idea behind this is to start small and gradually increase the amount each week.
This approach makes saving money feel more manageable and less daunting. Because you are only committing to saving small amounts at first, while slowly increasing the amount over time.
There are different ways to do this challenge. You can start by saving $3 in the first week while adding $3 in each of the next weeks for 26 weeks. Another way is to start with $4 and do the same.
If you want to save a little more money then go for saving $5 or $10 each week with increasing amounts.
Here is what the different 26-week money savings charts look like:

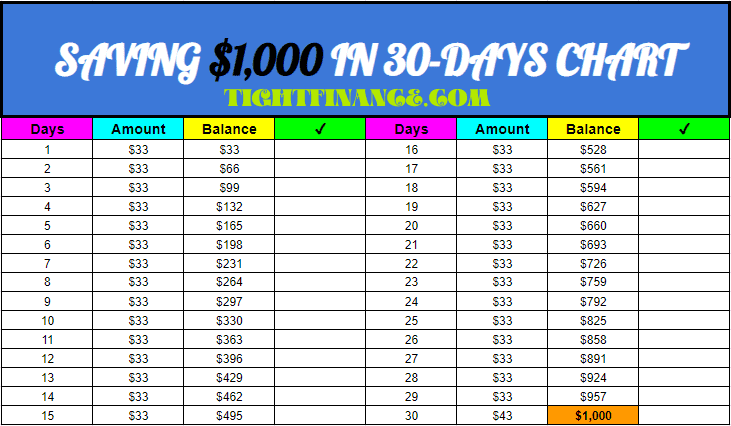
4. Saving $1,000
An easy-to-do challenge for saving a little fund in a short period. It is the best choice if you want to buy baby products, dine out, or emergency fund. As a beginner in saving money, it’s the best challenge to start without getting overwhelmed.
Saving $1000 can be done in a year, 3 months, or in a single month. If you want to do it in a year then it a so easy but little amount will be saved. In 3 months the savings get speed up and you save $77 each week for 13 weeks.
While for making it faster, go for a monthly challenge. Here you have to save $33 each day for 30 days. Here is a money-saving chart for the $1,000 saving challenge:
5. $10,000 Savings Chart
$10,000 is a big amount of money if can save it in a year. You can use this fund to cure emergencies, pay off student loans, make big purchases like a refrigerator or washer, pay off credit card loans, and a lot more funds as well.
Save that much fund is a big challenge, usually when your income is low or moderate. So instead of doing it in 100 days, 3 months, or even 6 months is a big challenge that most folks claim to do online.
The best option is to go with 52 weeks or over a whole year. If you divide $10,000, you have to save only $192.30 per week. That comes down to only $27.48 per day which isn’t a big deal.
There are other random charts available online. You can follow them as well but going an equal amount of saving per week is an easy way to complete this challenge.
Here is a $10,000 money-saving chart:

6. $5,000 Savings Chart
It works the same way as saving $10,000. But the amount is half of that so you can either choose to save $25 per day for 200 days or $50 for 100 days. You can also complete it in a year to feel easier.
Another option is to save $20 for 250 days straight. If you follow the 26-week or 6-month timeframe, you have to save around $192.30 per week. There are charts available to help you save a random amount of dollars each week.
Here is a money-saving chart for saving $5,000:
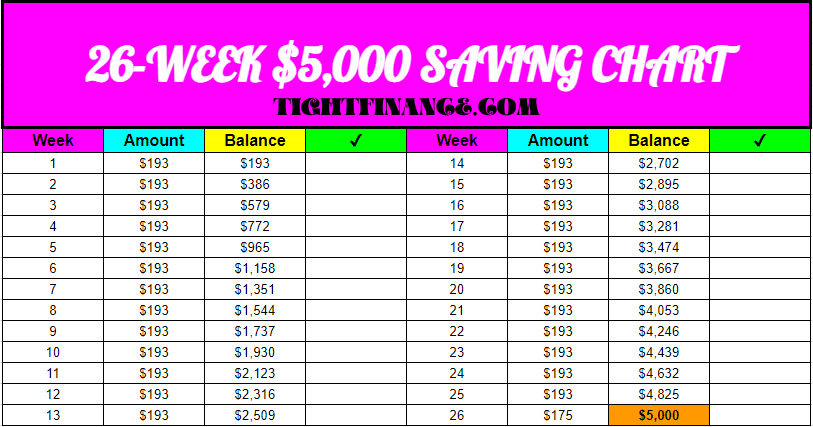
It’s also a big amount to pay for large purchases, credit card payments, student loans, personal loans, and emergency funds.
7. $3,000 Savings Chart
Dividing the $3,000 over 100 days you have to save $30 per day while in 26 weeks time frame you have to save $115.40 per week. Going for 52 weeks you only save $57.70 per week which is a lot easier. Now it’s upto you which option attracts you the most. Following a $3,000 money-saving chart with random amounts is also a good choice. Use the above 26-week tracker for saving $3,000.
RELATED POST: 23 Money-Saving Challenge Ideas To Build A Big Saving Fund
8. Saving $5 challenge tracker
For doing this challenge there are two ways. First, save $5 per day for 365 days which gives you $1825. It’s easy but you can’t accumulate big funds.
The second trick is to start at $5 each week with an increasing amount for 52 weeks. That is $5 in the first week, $10 in the second week, $15 in the third week, and until the 52nd week. The total money saved this way helps you save $6890.
Here is a money-saving chart for the $5 challenge:

9. Saving $100 A Week
A small challenge but the best way to adopt the saving habit and prepare yourself for medium and bigger more challenging saving targets. To complete this challenge you can start saving $15 for 6 days and $10 on the 7th day.
10. Saving $500 A Week
It’s a little bigger than the above challenge. Here you have to save $70 for 6 days and $80 on the 7th day. This method is a good option if you need money for making any payment after a few days.
11. Saving $1,500 A Month
In this challenge, you save $50 each day for 30 days. A good choice for saving big funds and meeting a payment coming soon. Use the above $1,000 in 30 days money-saving chart.
RELATED POST: 20 Budget Templates To Confidently Track Your Money
12. Saving Spare Change
If you check your pockets and places around your living room then you can find a lot of spare change for saving. From everyday transactions, we all get money change in the form of small currency notes and coins. Saving them really helps you build a fund over a quarter or yearly time frame.
You can use either a monthly saving chart or a 52-week money-saving chart. Going longer will help you save a bigger amount. YOu can use a piggy bank or a box for saving. Depositing it into a saving account each month is also a good idea.
13. House Down Payment Savings
Buying your own house is a major dream in our life. But it comes with certain obligations that we all have to fulfill.
According to the Bank of America, lenders require buyers to make a downpayment ranging from 5% to 20% of the home purchase price. So it makes sense to save money today to make that payment in the future.
A monthly saving chart can help you track savings to down payment over a specific time. You can extend it to a year or two according to your financial situation. But you stay motivated while seeing the progress as you move forward.
RELATED POST: How To Pay Off Debt Fast (11 Bullet Proof Tips)
14. Vacation Fund Savings
In the US an average cost of a vacation for a single person is $1919/week. And it increases when you go on vacation with family or friends.
It includes:
- Cost of traveling
- Food and drinks
- Transportation
- A hotel stay or composite
- Park and entertainment
The vacation money saving chart helps you track vacation savings for you and your family including your children. To create a vacation savings chart you first need to create a vacation budget and estimate the cost of how much you want to spend on your next vacation.
After that give yourself time to achieve that money milestone. During that period write down your regular savings for vacation fund on the money-saving chart to stay on track while achieving the goal.
If you want to save $3,000 on a vacation in the next 5 months then you have to save $600 per month. That comes down to around $140 per week. Now you can create a 21-week chart to track deposits of each week and accumulated balance.
RELATED POST: Cash Envelope System: 9-Simple Steps To Do Envelope Budgeting
15. Summer Savings Fund
In this challenge, you have to save money during the summer season. In the US summer season consists of three months from 1st June to 31st August. What you can do is place a thermometer in your house and record the temperature for all 7 days. Now take the average of all the temperature values and save money equal to the average temperature.
For example, you have temperature values 80, 90, 95, 100, 105, 94, and 86. Now add all these 7 values and divide by 7. You get 90.30 which means you save $90.30 in the first week. Continue this process for the 13 weeks on your money savings chart and you’ll have a big stash of cash.
Here are the major columns on your saving chart:
- Weeks
- Average Temperature
- Deposit
- Balance
RELATED POST: Budget by Paycheck Workbook: 6 Steps for Making a Paycheck Budget
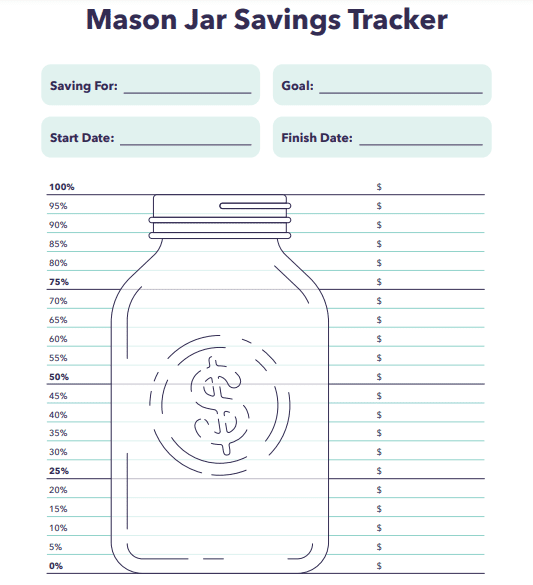
16. Jar Savings Tracker
Another interesting savings challenge to track with money saving chart. The process is the same as in monthly, 52-week, and 26-week challenges. But the template or chart structure and presentation are different.
The jar saving tracker has a picture of a jar with balance marked on it with lines. The jar sides have two columns with the deposit and date or week. It’s one of the best ways to visually analyze your savings challenge progress and move forward toward the target.
Here is a jar savings tracker from Intuit Mint:
17. Wedding Fund Savings Chart
The average cost of a wedding in the US is $27,000 as of 2022. That is a big expense for low to medium size men and women.
If your marriage is near in the future then you have to plan this budget today. Calculate the estimated cost you want to spend on your wedding as you do in the vacation budget. Now use your money-saving chart accordingly. But don’t try to go overboard instead find frugal ways to save more money.
RELATED POST:
18. Christmas Holiday Saving Money Chart
The average consumer spends $870 on the Christmas holiday which includes gifts, posting, traveling, and loyalty cards. It is not a big deal for most people but the expense is an expense and you have to budget for it.
You have to do early planning for saving that much amount. Here the money-saving chart will help you not only set a time frame but plan out different types of things you spend money on. For example, gifts, loyalty cards, postage, and many others.
19. Credit Card pay-off tracker
Paying off credit card loans is necessary to use credit card services in the future, maintain a credit score, and obtain other loans. The average credit card debt is $6,004 as of Q3 of 2022 in America.
The money-saving chart not only helps you save money but also tracks your credit card debt balance while paying it back. Here to create a tracker you need the date payment, date, and the remaining balance columns. This helps you cut down your interest and pay it off more quickly.
Here is how the credit card payoff tracker looks:

20. House Fund Money-Savings Tracker
Having your own house comes with a lot of extra costs and expenses. For example, maintenance and caring, coloring walls and windows washing a floor, cutting grass and trimming plants in the backyard, planting new flours, insurance, wiring plus gas connection, repairing, and many more.
All of that need money that you can easily spend to fulfill these requirements. Using a money-saving chart you can build a house-saving fund by setting a time benchmark. It helps you track which expenses you can cover from the fund and which are left.
RELATED POST: 31 Budgeting Tips for Beginners to Easily Grow Your Savings
21. Tracking Student Loan Payment
We all need to take education and as a result, take student loans from the government and private institutions. But after completing the education we have to pay it back including the interest cost.
Using a student loan payback planner you can track the number of payments, interest amount, principal amount, and remaining balance. As a result, you have a clear picture of when you get out of student loan debt.
Here is a simple student loan payment planner:

22. Auto Loan Pay-Off Tracker
The car loan payment tracker is just like the above student loan tracker but with only 4 columns. It has a date, starting balance, and payment remaining balance. Means how much you’ve paid and how much is remaining. You can use the student loan payment chart for the auto loan repayment track.
23. Personal Loan Pay-Off Tracker
Do have a personal loan outstanding? You can track its repayment using a tracker or amortization planner. The template works the same way as student loans and auto loans.
RELATED POST: How to Pay Off Credit Card Debt Fast (17 Quick Tips)
24. Auto/Car Fund
Buying a vehicle may be one of your financial goals. To cover the different associated costs like down payment (10% to 20%), repairing, tuning, washing, fuel, changing tires and engine. You should have a savings fund in place to fulfill these requirements.
25. Mortgage Payment Tracker
A mortgage is the biggest debt in America and around 42% of households have mortgage loans outstanding. To pay it back you need as much bigger motivation and planning. The mortgage payoff tracker has four columns date, payment, remaining balance, and interest column. The chart can be longer depending on the terms of the mortgage loan.
26. Retirement Savings Tracker
With the retirement money saving chart you can track 401k, IRA, Roth IRA, and other stock investments like mutual funds. It includes the date, deposit, and remaining balance column. So you have a clear picture of how much you’ve deposited, what is in return, and how much time remains to achieve your required investment goal.
27. Pocket Money-Saving Chart
This tracker is helpful for kids and students who receive pocket money from their parents and kids’ allowance. In the US average allowance for kids under 6 years is $3600 while those from 6 years to 16 years receive $3,000.
Saving these amounts to achieve goals like paying school fees, and buying a child’s vehicle, bike, or cycle is a good idea. The money-saving chart will help you track the amount towards achieving the goal.
RELATED POST: 52 Ways How to Make Money as a Teenager Working (Online and Offline)
28. Saving For Big Purchases
There are a lot of purchases that need much more money as compared with normal purchases. For example, the new version of the iPhone, refrigerator, washer, LED, or any other.
So you can start early savings for that purchase. For creating a money-saving chart you need to estimate the cost, then create a column for the date, deposit, and remaining balance.
RELATED POST: How To Make Money Without A Job (55 Lucrative Ways)
29. College Fund Money-Saving Chart
A college fund is an important investment for covering common expenses like books, hostels, and uniforms. The more money you have the lesser the debt amount. If you’re using a mutual fund or 529 plan to earn interest and build the fund faster over your graduation period. Tracking the targeted amount with money saving chart will help you better visualize the progress.
For example, you want to save $15,000 at the end of a 4-year program. And you make a deposit to a mutual fund every month that earns you an 8% yearly return rate. Now calculating the monthly payment you have to deposit $366 each month to reach $15,000 at the end of 4 years.
RELATED POST: How to do Zero-Based Budgeting Using 5 Simple Steps?
30. No Spend Money-Saving Chart
A fun challenge that helps you avoid spending throughout a certain period a cut back unessential expenses. For example impulse buying, eating out at restaurants, and junk food. It doesn’t mean that you put a sealing on your necessary costs, instead, they go smoothly as needed.
There is no column on the no-spend tracker. You have dates for the whole month and decide in advance on which days you don’t spend money on unnecessary expenses. As a result, you can compare the monthly expenses of the spend month with the previous regular month. You really see positive results if you did it correctly.
How To Save More Money?
Saving money can be a challenging task for you, but essential for financial stability and reaching long-term goals. Whether you want to save for a car, house fund, or emergency fund you should know the tips for saving more money.
Here are 10 strategies for saving more money:
1. Create a budget
Identify your income and expenses. Prepare a list of your fixed and variable expenses. For example, rent, bills, groceries, dining out, or entertainment. You get an idea of where your money is going and where you can make adjustments to save more.
RELATED POST: How to Create a Personal Budget [6 Easy Steps] PLUS Template
2. Reduce expenses
Once you have a clear picture of your expenses, look for ways to cut back on expenses. For example, cutting back on dining out, canceling unwanted subscriptions, or finding cheaper alternatives for regular expenses.
RELATED POST: 10 Best Budgeting Apps of 2022 (Free + Paid)
3. Increase income
Another way to save more money is to boost your income. This could include doing a part-time job, freelancing, or starting a side business. Ask for a raise at your current job, or choose a higher-paying field.
RELATED POSTS: What is a Six-Figure Salary? 25 Jobs That Pay You Six Figure
4. Automate savings
Setting up automatic savings plans can help you save more money without thinking about it. This could include direct deposit from checking into a savings account or using apps that automatically transfer small amounts of money into savings regularly.
5. Set specific goals
Having a specific goal in mind, such as saving for a down payment on a house, can help you stay motivated to save more money. Break down the goal into smaller, more manageable steps, and set a deadline for achieving it.
6. Use the Saving Money Chart
Tracking your progress toward your savings goal can help you stay on track. Keep a record of how much you have saved and how much you have left to reach your goal. This can be easily done using a money-saving chart.
RELATED POST: How To Make a Budget Binder In 4-Simple Steps (Free Templates)
7. Avoid impulse buying
Impulse buying is one of the biggest obstacles to saving money. Avoid it by making a list of what you need before going to the store, and stick to it.
8. Make an investment
Putting your money into investments such as stocks, mutual funds, or real estate can help it grow over time, in addition to your savings account. It’s important to research and consults with a financial professional before making any investment decisions.
9. Evaluate your insurance
Review your insurance policies and look for ways to reduce costs by increasing deductibles, removing unneeded coverage, or shopping for better rates.
10. Seek a financial advisor
A financial advisor can help you evaluate your financial situation and create a plan that takes into account your goals and circumstances.
Following these steps helps you take control of your finances and save more money. Always stay motivated and focused on your goals, and be patient with yourself. Saving money takes time and effort, but the rewards are well worth it in the end.
Conclusion
There are 30 different money-saving charts discussed in this article.
Now you can pick any of the challenges and download the picture or Excel sheet of that challenge tracker and start achieving the goal.
The best way is to print out the chart and write down your progress during the challenge.
To become successful at using the chart and doing challenges until the end, stay consistent and motivated from previous progress achievement.

- $11.50 An Hour Is How Much A Year In Gross And After Tax - April 7, 2024
- Does Amazon Deliver on Saturday and Sunday? (2024 Updates) - April 3, 2024
- How to save $5000 in 6 months? Proven Tips And Breakdowns - March 25, 2024