Last updated on January 22nd, 2024 at 11:19 am
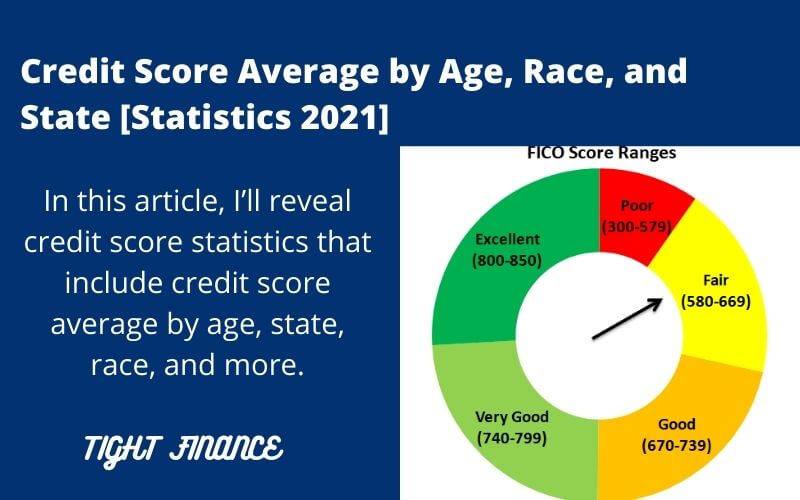
In this article, I’ll reveal credit score statistics that include credit score averages by age, state, race, and more.
This will help you get an idea of the current nation’s credit score and compare yours with it.
Here the main focus will be the FICO credit score statistics. Because it is used by 90% of lenders and other credit unions to assess the position of a consumer. We also touch the VantageScore which is used by 10% to 20% of lenders.
So for getting more information on credit score data let’s dive into the article.
What is the FICO score?
FICO score is the most used credit score among US lenders to examine their consumer’s creditworthiness. It is also a flexible score as compared to the VantageScore.
There are five different ranges of FICO scores. These ranges determine how much creditworthiness a particular consumer has and then the lender takes their decisions accordingly.
The five ranges of FICO score include poor, fair, good, very good, and excellent.
The poor category range from poor (300-579), fair (580-669), good (670-739), very good (740-799), and finally excellent (800-850). As lower your credit score is, it becomes more and more difficult for you to take a loan and vice versa.
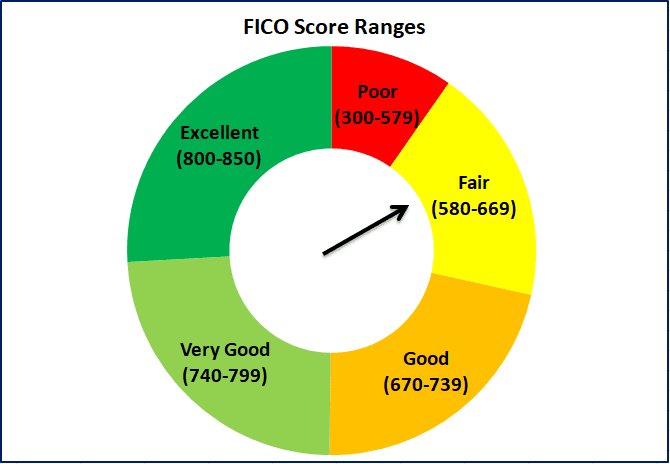
The numbers above 670 make it easy for you to take a loan. If you cross the very good and excellent category then it is fantastic. But remember a high credit score doesn’t guarantee that you get approved for a loan each time.
These numbers differ when you see credit score averages by age, state, race, and gender.
In this article, the major focus will remain on the FICO score statistics.
How does FICO’s credit score is calculated?
The FICO score is calculated using five different factors. In which payment history, credit utilization, length of credit history, credit mix, and new credit are included. Let’s understand them one by one below:
1. Payment history
It is the most important of all five because it has the most weightage in calculating your credit score. 35% of the weightage goes to payment history. This means as the excellent your payment history is the more your credit score will improve. This also helps you pay off debt faster.
2. Amount owed
It is the second most important factor. The amount owed means how much credit you’ve used out of the credit limit you have. It is also referred to as a credit utilization ratio which is determined by dividing the balance you owe by the credit limit. The credit usage has a 30% weightage in your FICO score calculator. If you keep this ratio lower your overall score will improve.
3. Length of credit history
The third factor with the most weightage is your credit history length. It is a record of your past credit behavior including how many credit lines you’ve, how much debt amount you owe, and the responsibility you show towards paying that debt. Its weightage is 15%.
4. New credit applications
This factor has a 10% weightage. It includes analyzing how many new credit accounts you opened or applied for. Also the number of hard inquiries and their impact on your credit score. If you don’t have too many new accounts and hard inquiries then it improves your credit score.
5. Credit mix
This factor analyzes the different types of loan accounts you have. It includes credit cards, student loans, mortgages, personal loans, auto loans, etc. If you have a mix of different credit accounts then it has a positive impact on your credit score. Just having a single account like a credit card or student loan makes you look riskier. It has a 10% weightage in your FICO score calculation.

Out of all these five factors, the most important are payment history and credit usage. The reason is that they have 65% total weightage and if you can better manage them then your credit score will stay higher.
There is no discrimination involved whether it is credit score average by age, race, or gender.
Related Post: How to Avoid Debt to Make Yourself Financially Strong
Credit score national average in the US
In October 2019 the average FICO score was standing at 706 which surged to 711 in October 2020. While in April 2021 it increases by 5 points and now standing at 716 according to the FICO report. This means the average national credit score falls in a good range.
From 2011 onwards the credit score showed a continuous increase year by year. But the increase in points varies among different years. In some years it increases by just 1,2, or 3 points while in others 4 to 5 points.
After October 2005 FICO score increased from 688 to 716 in 2021. This is a 28 points increase which is 4%. From October 2005 to October 2008 it shows ups and downs of just one point each year. But in 2009 after the mortgage recession, the score decreased from 689 to 686.
Here is the comprehensive table showing the data from 2005 to 2021.

What percentage of Americans fall in each FICO score range?
The percentage of Americans for different categories of FICO score varies.
16% of Americans fall in the poor credit score category.
That is between 300 to 579. This may be due to bad payment history, high utilization ratio, a high number of new accounts, thin credit files, etc. Consumers with this kind of credit score face difficulties in obtaining an unsecured loan. While obtaining a secured loan is easy because it has collateral that is used in case of default. Following the credit score improvement practices you can improve such kinds of scores very fast.
18% of Americans have their credit score in the fair category.
This ranges from 580 to 669. This is also not very strong and is considered a low credit score. Here the possibility is that consumers may default in the future. With this category, you first don’t get a loan and if you’re approved then the interest rate will be much higher.
21% of American debt consumers fall under a good credit score.
This is between 670 and 739. These consumers have a greater chance of getting approved for loans and can obtain lower-interest loans successfully. The average credit score of the whole US nation is in this category with 716 points.
25% of consumers have a very good category which is between 740 and 799.
This is an amazing credit score because you’re above the average of the whole nation’s credit score. Lenders give you loans at the best rates whether it is a credit card, personal loan, student loan, or consolidation loan. You can even get 0% APR credit cards very easily.
20% of Americans have an excellent credit score of above 800 to 850.
Consumers with these categories have very lower chances of getting denied. They also get very low-interest debt which is good for saving money. It also helps get higher credit limits and is approved for multiple loans easily. If you are in other categories and want to improve then following the practices of improving your credit score is important because from 740 onwards the points increase very slowly and less in number.

So this is how the whole nation’s debt consumers are distributed among five credit score categories. Here 66% of consumers have an above 670 credit score while only 34% have a below it.
Now let’s jump to the next section which discusses credit score average by age group.
What is the credit score average by age?
The FICO score varies greatly among different generations. It is analyzed that the more age a person has the higher their credit score is. Here are some reasons:
- Older people have more experience with credit scores.
- Their credit habits are good and they take debt responsibility seriously.
- They have enough time to improve if any downturn hits their credit score.
- These people enjoy different old-age benefits from lenders and the government.
- The income level of these people is high with their higher experience.
Now Americans fall into five generations categories. They include the Silent Generation, Baby Boomers, Generation X, Millennials, and Generation Z. All these have different credit score numbers. You can analyze in the below table that each generation with higher age has a better credit score than with a low age generation. Here is it.

After credit score average by age comes the next section which discusses statistics by state.
Related Post: What Is Financial Planning? How to Do It In 12 Easy Steps?
What is the credit score average by the state?
When it comes to the USA states then as with the national average the credit score also increases by state. This increase was better as compared to the year 2019 because in 2020 all 51 states show an uptrend while in 2019 only 42.
See the graph on credit score average by state.

In 25 states the growth in credit score was more than 7 points which is a normal growth rate. For example, the District of Columbia +10, Delaware +9, and California +8 points. While in other states this growth was either 7 points or below it while the average across 25 states is +3 points.
There are two states, Arizona and the District of Columbia with an increase of 10 points which is the highest among all 50 states. Their credit score was low as compared to others that’s why the change was just 2 to 3 points greater than the other states.
The Minnesota state remained at the highest credit score of 739 which is the border of the good category starting from 670 and ending at 739. No state in all 50 has a credit score in the 740 to 799 range.
Those states with the least increase like Nebraska (+5), South Dakota (+4), North Dakota (+3), New Hampshire (+5), and Georgia (+4) have more than the average credit score of 706 in 2019. Here is the table.


The average starting credit score of states which show the highest increase was 695 in 2019. These 25 states show an increase of 7 to 10 points in 2020. While the other 26 states with the least increase have an average starting score of 720 in 2019. This means that the poor and fair credit score gains more points as compared to the good and above.
Related Post: How to Use Debt Avalanche Method to Quickly Pay Your Debt?
What is the average credit score by race?
The credit score differs when it comes to races in the United States. These races are divided into four groups. The Asians, White, Black, Hispanic, and others.
Among these five groups, Asians have the highest credit score which lies in the very good category of 740 to 799. The Black has the lowest but falls in the good category (670 to 739) with the White, Hispanics, and others.
Here is the credit score data for all five races:

Now, why there is a difference that Black and Hispanics have the lowest credit score among all races? This is discussed in several publications and they name it discrimination. Here are some comments from articles from these publications.
- The Forbes article mentions that 1 in 5 Blacks while 1 in 9 Hispanics have a credit score less than 620. On the other hand, 1 in 19 white have less than 620 credit scores. According to them, there is a long history of discrimination in data that is being used in today’s credit scoring models.
- According to a CNBC article, a credit applicant person of color get worse credit terms as compared to a white. They also mention that the Nation Fair Housing Alliance investigation reveals that 60% of the time an applicant of color gets a high-priced car loan which costs them $2,662 more a year as compared to a white. While he is more qualified than the white.
But there may be other factors involving credit history, credit utilization, credit limit, interest rates, and credit mix, etc that can impact their overall score. Or it can be due to showing less responsibility toward their credit balances.
Above we’ve discussed credit score averages by age, race, and nation. Let’s jump to the next section.
What is the average credit score by economic class?
The economic class division includes people with low income, moderate-income, middle income, and high income. That’s why their credit scores also differ depending on how much they earn each month or year.
The reason is that people with low income have less capacity to stay regular on payments and keep a low credit utilization ratio. They face financial hardships which hold them back from paying off debt on time which leads to delinquency. Similar to that they use more of their available credit limit to meet their needs. All of this negatively impacts their credit score.
As the income level increases and goes towards moderate and middle-income levels, the credit score improves tremendously. This is because of an increase in capacity to pay and a decrease in chances of delinquency or default.
When it comes to higher income class people their credit score jumps towards a very good category. They have a huge income and so a greater ability to pay debt and very less chance to default.
Here is the credit score for all of the four classes:
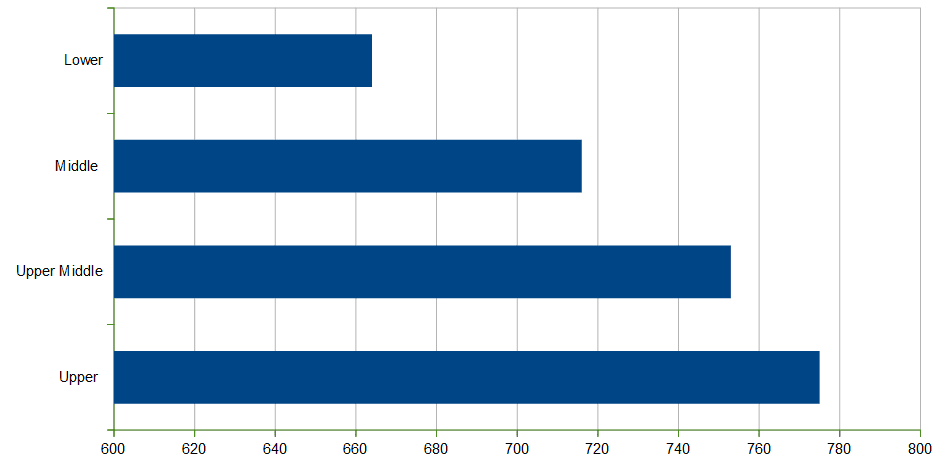
You can see that low-income individuals have credit scores that are in the fair category, while moderate-income people beat them with 34 points and are in the good category. Middle-income people are also in the good category but with 43 points more than moderate-income consumers. And high-income consumers are in a very good category with 39 points more than middle-income consumers.
The average difference between each category and to next one is around 39 points.
But the higher income doesn’t guarantee that the credit score stays high. This is because most of the time high-income individuals get into more sophisticated credit limits and spend more which derails them from making on-time payments and keeping the utilization ratio below 30%. Which ultimately has a bad effect on their overall credit score.
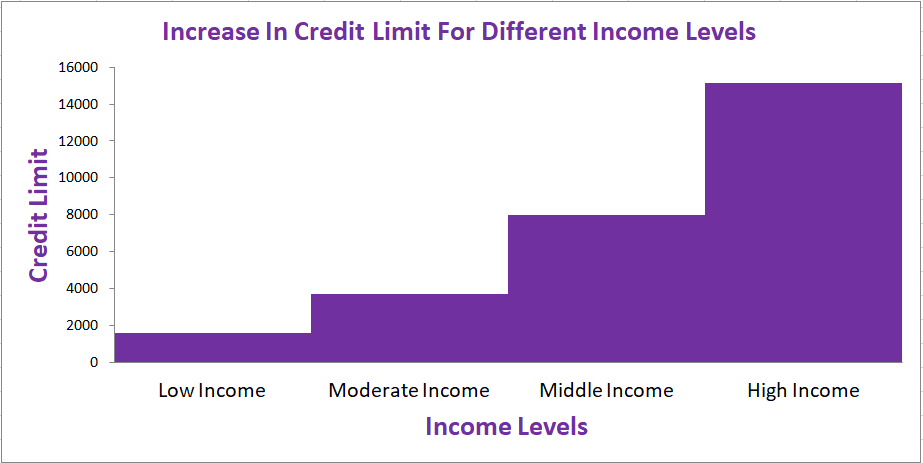
The credit limits also differ according to income levels. As more you earn the more credit limit you get from the lenders. You can see in the below chart which takes data from the Federal Reserve Bank of New York regarding credit limits. The low-income ($1,602), moderate-income ($3686), middle-income ($8001), and high-income ($15,123).
Here is a graphic representation of the data.
The credit limit is also offered according to the median income of a particular area in which the consumer lives. Here are the statistics:
- Low-income people get credit limits up to a maximum of 50% of their area median income.
- Moderate-income people get credit limits starting from 50% up to a maximum of 80% of their area median income.
- Middle-income people get a limit starting from 80% up to 120% of their area median income.
- While high-income individuals get more than 120% of the area’s median income.
Related Post: How Does Student Loan Work? The Ultimate Guide!
Why average credit score is increasing in the US?
There are several reasons that are helping credit scores continuously increase from 2019 to 2021. The more important ones include delinquency rate, credit limit, number of credit card accounts, and credit utilization rate.
Here are the statistics regarding all these four factors:
- From 2019 to 2020 the credit card debt decreased by $74 billion which is a -9% change. It dropped from $829 billion in 2019 to $756 billion in 2020.
- The number of credit card accounts increased by 2.4%. In 2019 these accounts numbered 485 million while in 2020 they were 497 million. As the number of new credit card accounts increases the credit limit increase, and as a result, the overall credit usage ratio decrease which has a positive impact.
- The individual average credit card balance also decreased by 14%. And this change was seen in all states in which the District of Columbia was at the highest with -20% followed by Alaska -18%.
- The average credit usage is down from 29% in 2019 to 25% in 2020 a -4% change.
- The credit limit increased among two generations Generation Z (18-23) and Millennials (24-39).
- Last but not least the number of delinquent payments also decreased. From 2019 to 2020 the accounts with 30 to 59 days of delinquency decreased by -33%, 60-89 days by -31%, and 90 to 180 days by -24%.

These are the factors that help the overall credit score to +5 points jump upward. From 2019 to 2020 and now from 2020 to 2021.
How to increase your credit score?
If you’re in a poor, fair, or good credit score range then you can still improve it further. What you need to do is consistently follow the best practices and your credit score starts improving.
Here are some simple tips that can help you:
- Make regular payments before that date ends. This is because the payment history has the largest impact when it comes to calculating credit scores. So take them seriously.
- Do not use more than 30% of your available credit limit. The more you use it, the more negative impact it put on your credit score. Because it has 30% weightage. If the ratio goes beyond 30% then make enough payments to stay below that range.
- If you’ve high-interest credit card debt then you can also take help with debt consolidation. Using this method the existing debt is paid off with a new low-interest debt.
- Don’t open too many new credit accounts because it will result in hard inquiries and a decrease in credit scores.
- If your credit file is thin then make it fate. This helps your lender and credit bureaus to have more information for calculating credit scores.
- Check your credit report regularly for mistakes that can hurt your credit score. You can get the report from credit bureaus like Equifax, Transunion, and Experian.
So these are some tips that can help you build your credit score. But remember this is not a fast way because it takes some time to actually see the improvement.
Other Related Posts:
67 Best Personal Finance Blogs To Sharpen Your Financial Wisdom
Links to sources

- $11.50 An Hour Is How Much A Year In Gross And After Tax - April 7, 2024
- Does Amazon Deliver on Saturday and Sunday? (2024 Updates) - April 3, 2024
- How to save $5000 in 6 months? Proven Tips And Breakdowns - March 25, 2024